


Make It Work
Software developers are really good at getting stuff working, they really are! Even when faced with absurd deadlines, scatter-brained product owners and conflicting demands. Sure some people need a little guidance here and there and some may produce more bugs than others but on the whole functionality is delivered without too much fuss. A lot of the applications that we build are relatively simple in terms of functionality so I have confidence in most developers to be able to get stuff working to meet the functional requirements of a project. A working system, fully tested, fully signed off, perfect, job done. Oh what’s that? It needs to serve 1000 pages per second? Errr, help! This sort of non-functional requirement often gets overlooked until the last minute and dealing with it, in my experience, involves a lot more fuss than the functional stuff, especially when left this late in the day.
Make it scale
In the web development industry it’s easy to see how people are more adept at making things work than making them scale. Perhaps you start out doing front-end stuff, then move onto some backend programming using PHP or Python, maybe moving onto Java or C#. Maybe you start by building sites for your mates then get a job writing business process systems. It is probably fairly rare that you get asked to support massive volumes of traffic, to query huge volumes of data, to reduce page response times or to reduce server resource utilisation. ‘The Server’ may well just be a black box that just copes with everything magically.
Rather than sit here whining I’ve decided to explain some of the core concepts behind performance-tuning of web applications. First off; how we make the most of the CPU.
Performance Tuning CPU Utilisation in Web Applications
The CPU is the heart of our server and for many applications it is likely to be the first bottleneck that you hit. First let’s examine how we measure the CPU performance of our application
Wall Time
Simply put this is the time it takes to render a particular page of your application, as you might measure it with your wall clock. You can easily get a rough idea of this by doing something like this:
time curl http://localhost/myapp.php
(I’m assuming many things here, like you’re using Linux, PHP, you’re hosting your app locally etc)
There are two main components to the wall time that we’ll look at. ‘CPU time’ is how much time your process was actually swapped onto the CPU consuming it’s cycles. ‘I/O time’ or ‘wait time’ is the amount of time that your process was basically waiting for something to happen, be that waiting for a response from a database or API, or waiting for local resources to become available (e.g. disk, CPU etc).
Performance tuning CPU time
An application that uses pure CPU is fairly rare but a very simplistic app would be something that just counts up to a very big number:
<?php

for ($i=0; $i<1000000000; $i++) {

//do nothing

}
If you run this code you will see your CPU ‘spike’ to 100% (or near as damn-it). If you have a multi-core system you will notice it only spikes one core (more on that later). Let’s turn the big number down a bit to simulate a realistic application. If you change it to 4 million then on the system I’m currently using this takes about 200ms of wall time. Because this is basically a pure CPU application we can assume that the CPU time is essentially the same as the wall time (not strictly true but true enough for this illustration), so we’re consuming 200ms of CPU time to render this page. That’s still fairly quick right? A user probably wouldn’t notice 200ms of delay, with all the network latency and asset loading of the web page to do, this will pale into insignificance right? Plus the page isn’t doing much so we’ll be able to serve loads of them right? Nope.
Think that we’re using the entire CPU for 200ms. Nothing else can realistically use that CPU core for a period of 200ms. So how many of these things can we actually serve up? Well doing some simple maths if we continually hit this page, serially requesting a new page as soon as one has been served up then we’ll be constantly eating up the CPU time of a single core. With purely serial requests like this against a single core you’ll be able to get up to 5 requests per second. Simple really it’s just 1/0.2
5 requests per second ain’t so great. That’s basically saying that some guy could melt your server by just pressing F5 as fast as he can. As soon as your server is trying to serve more than 5 req/s it is going to be in trouble if that is sustained over a long period.
So how do we scale it? Well the obvious thing is to get a faster CPU. If I double my CPU speed then my CPU time is going to come down to 100ms and I’ll be able to serve 10 req/s. Awesome! But there is a limit to how high you can go with this kind of ‘vertical’ scaling. More prudent would be to add more cores. If I add a second core then the operating system will be able to run two of these page requests in parallel at the same speed as before. My CPU time will remain at 200ms but I’ll be able to do 2 at a time so I’ll be able to get to 10 req/s just as with the faster CPU scenario. This is horizontal scaling and it is much more sustainable. Push it up to 8 cores and I’ve got 40 req/s. 32 cores (not unrealistic for some servers!) and I’ve got 160 req/s. We’re flying now! For a purely CPU-bound application the following formula quite neatly sums this up:
Max Req/s = Number of Cores / Response Time
Monitoring CPU time
When you have multiple cores and multiple parallel requests attacking them it can get quite complex to work out what is going on from the point of view of the user agent, you really need to get inside the server and have a look (from an OS perspective that is!). To illustrate the scaling I’ve just described working in practice there are some handy tools we can use. For flinging lots of requests at our page we can use apachebench. To monitor CPU utilisation you can use any of the standard linux tools such as vmstat, top, iostat, but I personally recommend dstat. These both work fantastically on Linux. If you’re using Mac or Windows you’re on your own I’m afraid; you should have installed a proper OS! 😛
If you run dstat -f you’ll see loads of numbers printing down the screen (make sure your terminal is wide enough to fit it all in). Mine looks like this:
-------cpu0-usage--------------cpu1-usage--------------cpu2-usage--------------cpu3-usage------ --dsk/sda-----dsk/sdb-- --net/eth0- ---paging-- ---system--
usr sys idl wai hiq siq:usr sys idl wai hiq siq:usr sys idl wai hiq siq:usr sys idl wai hiq siq| read  writ: read  writ| recv  send|  in   out | int   csw
  7   3  87   4   0   0:  7   2  90   1   0   0:  6   1  92   1   0   0:  6   2  90   2   0   0| 416k   40k:  36k   28B|   0     0 |   0     0 |1529  2318
  6   0  93   0   1   0:  5   1  93   0   0   1:  4   2  93   0   1   0:  5   1  94   0   0   0|   0     0 :   0     0 |   0     0 |   0     0 |1143  1887
  7   3  90   0   0   0:  4   1  95   0   0   0:  6   1  93   0   0   0:  7   2  91   0   0   0|   0     0 :   0     0 |   0     0 |   0     0 |1224  1920
  8  13  79   0   1   0:  5   2  92   0   1   0:  7   1  92   0   0   0:  3   0  97   0   0   0|   0     0 :   0     0 |   0     0 |   0     0 |1454  2230
 10   3  87   0   1   0:  5   1  94   0   0   0:  5   1  94   0   0   0:  4   1  95   0   0   0|   0     0 : 132k    0 | 196B   98B|   0     0 |1395  2289
There’s a lot to take in there but we’re really only interested in a few of the columns. Dstat is printing a line every second with loads of info about what is going on in your computer. Stuff like CPU usage, disk and network activity. If you look at the first row you’ll see the top level headings and you’ll see one for each CPU core you have (you can see that I have 4 cores). Each core then lists 6 different columns, most important of which is ‘idl’ which is a percentage measure of how much time the CPU is idling. If you run the cpu-spiking loop we made before but with the number shoved back up to a billion or so you’ll be able to see the spike in dstat:
-------cpu0-usage--------------cpu1-usage--------------cpu2-usage------
usr sys idl wai hiq siq:usr sys idl wai hiq siq:usr sys idl wai hiq siq
  5   1  94   0   0   0:  9   1  90   0   0   0:  3   1  96   0   0   0
  4   2  93   0   1   0: 18   0  82   0   0   0:  6   0  93   0   1   0
  6   1  93   0   0   0:100   0   0   0   0   0:  5   2  93   0   0   0
 10   0  90   0   0   0:100   0   0   0   0   0: 10   0  90   0   0   0
  6   1  92   0   1   0: 99   0   0   0   1   0:  6   1  93   0   0   0
  7   1  92   0   0   0:100   0   0   0   0   0:  3   1  95   0   0   1
  6   1  92   0   1   0: 67   1  32   0   0   0:  4   1  95   0   0   0
  2   3  95   0   0   0:  3   1  96   0   0   0:  4   0  95   0   1   0
  5   9  85   0   0   1:  7   0  93   0   0   0:  3   1  96   0   0   0
Watch cpu1 as the ‘idl’ value drops to 0 and the ‘usr’ value goes up to 100. This is the process ‘spiking’ that CPU. Notice how the other CPUs aren’t bothered by this at all; they sit there mostly idling. If you run the big loop script in parallel in two different terminals you’ll see that it will spike two CPUs, 3 loop processes will max out 3 CPUs etc.
If you stick the loop script under a webserver such as apache we can now watch the scaling example I presented in practice. Based on our previous numbers we should expect to be able to serve 5 requests per second per core with our ~200ms script. On a 4 core box like mine we’d expect to see four times that number, i.e. about 20 req/s. So let’s see! Apachebench is a simple application that allows you to fire requests at a URL and control how many requests to complete and also how many to send in parallel. Let’s try only 1 at a time and 100 requests:
rathers@geoff:~$ ab -n 100 http://127.0.0.1/cpu.php
This is ApacheBench, Version 2.3
Copyright 1996 Adam Twiss, Zeus Technology Ltd, http://www.zeustech.net/
Licensed to The Apache Software Foundation, http://www.apache.org/

Benchmarking 127.0.0.1 (be patient).....done


Server Software:        Apache/2.2.22
Server Hostname:        127.0.0.1
Server Port:            80

Document Path:          /cpu.php
Document Length:        0 bytes

Concurrency Level:      1
Time taken for tests:   19.835 seconds
Complete requests:      100
Failed requests:        0
Write errors:           0
Total transferred:      20200 bytes
HTML transferred:       0 bytes
Requests per second:    5.04 [#/sec] (mean)
Time per request:       198.353 [ms] (mean)
Time per request:       198.353 [ms] (mean, across all concurrent requests)
Transfer rate:          0.99 [Kbytes/sec] received

Connection Times (ms)
              min  mean[+/-sd] median   max
Connect:        0    0   0.0      0       0
Processing:   191  198   4.0    197     211
Waiting:      191  198   4.0    197     211
Total:        191  198   4.0    197     211

Percentage of the requests served within a certain time (ms)
  50%    197
  66%    197
  75%    198
  80%    201
  90%    205
  95%    206
  98%    211
  99%    211
 100%    211 (longest request)
A lot of output, but the figure we’re most interested in at the moment is “Requests per second”. This is at 5.04 req/s which is quite a bit lower than our estimate of 20! This is because we’re only running one request in parallel. Apachebench is firing off a request and waiting for that one to complete before it sends another. We are only allowing the server to process 1 loop at a time so 5 req/s is our theoretical max. We still have lots of headroom with our additional cores though so we should be able to get much higher. By doubling the concurrency we should get to 10 req/s:
rathers@geoff:~$ ab -c 2 -n 100 http://127.0.0.1/cpu.php

Requests per second:    10.09 [#/sec] (mean)
Nice. Let’s keep going. Concurrency of 3:
rathers@geoff:~$ ab -c 3 -n 100 http://127.0.0.1/cpu.php

Requests per second:    15.08 [#/sec] (mean)
Ok, what about concurrency of 4? This should give us 20 in theory, which also should be our theoretical max:
rathers@geoff:~$ ab -c 4 -n 100 http://127.0.0.1/cpu.php

Requests per second:    20.23 [#/sec] (mean)
Pretty close! So what happens if we push it too far? What if we try 8 concurrency?
rathers@geoff:~$ ab -c 8 -n 100 http://127.0.0.1/cpu.php

Requests per second:    20.33 [#/sec] (mean)
It’s basically the same! How can this be so? Well if you look at some of the other stats you’ll see why. If you look at the “Time per request” metric you’ll see that the mean was 200ms when concurrency was 4, but when concurrency was 8 the time per request was 400ms; double the amount! So we see that the CPU can’t churn out any more than 20 pages per second but if you ask it to do more in parallel it will just take longer to complete the requests. The OS is using time multiplexing to share 4 cores out amongst 8 processes. Each process only gets the CPU for half the time so it takes twice as long to complete its task.
Will this keep going forever? What if we hit it with a concurrency of 10 times our sweet spot? 100 times? Well you’ll not get above 20 req/s but the average request time will just keep going up and up. Eventually you’ll start hitting bottlenecks in other areas and the OS will be spending an increasing amount of resources swapping processes on and off the CPU cores. This means it becomes increasingly inefficient. So you’ll see the number of req/s actually start to decrease as you push the concurrency higher.
Here is a graph of actual results gathered on my box using our example script:
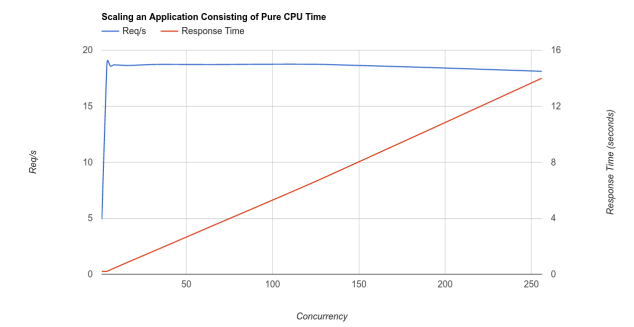
As you can see we hit the 20 req/s plateau very quickly and the throughput remains pretty much constant no matter what concurrency we throw at it, although you can start to see it tailing off slightly at higher concurrencies. The response time on the other hand starts off on the 200ms plateau but very soon starts rising linearly. The full results are publicly available on google docs
Dstat and apachebench Together
If you monitored dstat while doing the above tests you’ll see that the single concurrency example doesn’t just use one core, and the 2 concurrency example uses more than 2 cores. This is because the OS is choosing a different CPU core to process your request each time so on average with the single concurrency example you should see 25% utilisation across four cores rather than 100% on one and 0% on the others.
Monitoring Apache worker processes
When we were hitting the server with a concurrency greater than 1 the OS was spreading the load across multiple processes across multiple cores. This is because apache is (in some configurations anyway) set to spawn multiple webserver processes. Each process is effectively independent of the others and your OS can move them around CPU cores as it pleases. Because they are separate processes as far as the OS is concerned you can quite easily ask the OS to tell you how many apache processes are running. Run this command to see all your apache processes (you might need to grep for ‘httpd’ rather than apache on some systems):
rathers@geoff:~$ ps aux |grep apache
root      1369  0.0  0.2 127408  7964 ?        Ss   11:36   0:00 /usr/sbin/apache2 -k start
www-data  1391  0.0  0.1 127432  5012 ?        S    11:36   0:00 /usr/sbin/apache2 -k start
www-data  1392  0.0  0.1 127432  5012 ?        S    11:36   0:00 /usr/sbin/apache2 -k start
www-data  1393  0.0  0.1 127432  5012 ?        S    11:36   0:00 /usr/sbin/apache2 -k start
www-data  1394  0.0  0.1 127432  5012 ?        S    11:36   0:00 /usr/sbin/apache2 -k start
www-data  1395  0.0  0.1 127432  5012 ?        S    11:36   0:00 /usr/sbin/apache2 -k start
rathers   3191  0.0  0.0  28076   844 pts/1    S+   12:26   0:00 grep --color=auto apache
This should show you the grep command itself, the master apache process (running as root) and the worker processes (running as a low-privilege user). On my system I have 5 worker processes. So to monitor how many apache worker processes are running at any one time you can run this nifty little command:
watch -n 1 "ps aux |grep apache |wc -l"
This actually reports an artificially high number for reasons I don’t fully understand but it gives you a good tool to be able to monitor the increase and decrease in the number of apache processes. If you set this running and then run one of the high concurrency apachebench tests (concurrency of 20 say) then you’ll see the number or processes steadily rise until reaching a plateau. Once apachebench has finished its test then you’ll see the number slowly decrease back down to a low plateau. I’ll look at this in more detail later but this should give you an idea of the how apache is spawning more processes to deal with the concurrency (the number of worker processes should roughly match the concurrency) and how the OS is distributing the processes around your CPU cores.
Summary
We’ve seen how to spike a single CPU core and then watch how the OS starts to spread the work amongst less busy cores when further CPU intensive processes are started. We’ve seen the effect of pure CPU time on the requests per second that an app can achieve and it’s relationship to response time. We then experimented with scaling our CPUs vertically and horizontally. Finally we looked briefly at how apache and the OS work together to spawn worker processes and spread them out across available CPUs in order to make the most of your system’s resources.
In my next post we’ll look at the performance implication of wait time which is a totally different beast to CPU time.

Yes, I often like to program in Pyton. It’s like Python, but without those annoying .h includes 😉
Spelling pedant alert! (fixed it too! 😉
It’s a brilliant article though, by the way. And very timely for something I’m working on (which involves persuading someone to upgrade their servers now they are a supplier to the whole NHS rather than just 1 or 2 universities!) – although my initial reaction was that we were short of RAM rather than CPUs, seeing as Apache seems to take 60-odd MB per child process…
Also, your photo really, really looks like Frank Skinner when your wordpress shows up on mobile!
Cheer Tim, glad it’s of some use 🙂
So is your app actually CPU limited then, rather than RAM? I managed to get my 4GB box up to 512 apache worker processes without it complaining about memory, although they weren’t doing a great deal of PHP. I would think the bulk of the memory usage of a worker process is down to PHP for heavy apps.
The reason my photo looks so much like Frank Skinner is because it IS a picture of Frank Skinner!
Looking forward to part two which is when it gets really hard (*giggity*). Although be prepared for all the node.js fanboys to come along and insist you should be using event loops for everything 😉
Cheers Dan. Node fanbois will be well catered for, whatever they say they still have to use the same CPUs as the rest of us! 😉